.svg)
Openmart API performance benchmarks: Latency, uptime, and rate limits
Quick specs summary
The Openmart enrichment API targets real-time and high-volume workloads. The table below summarizes the performance characteristics technical buyers evaluate first. Numeric values are confirmed with the team before each release.
Metric Value Notes Uptime SLA 99.9 % Monthly availability guarantee, excludes scheduled maintenance Rate limit 20-100 RPS Sustained request ceiling per API key, varies by endpoint Concurrent connections Per-request queuing Managed via middleware with endpoint-specific limits
What these benchmarks mean for your integration
Percentiles describe what each request actually feels, and averages hide the requests that hurt. Picture 10,000 enrichment calls where 9,400 return in 50ms, 500 in 120ms, 90 in 600ms, and 10 in 8,000ms. The average lands near 118ms, but P50 sits at 50ms, P95 near 130ms, and P99 around 600ms (oneuptime.com). P50 tells you the typical call. P95 and P99 tell you how bad the slow tail gets.
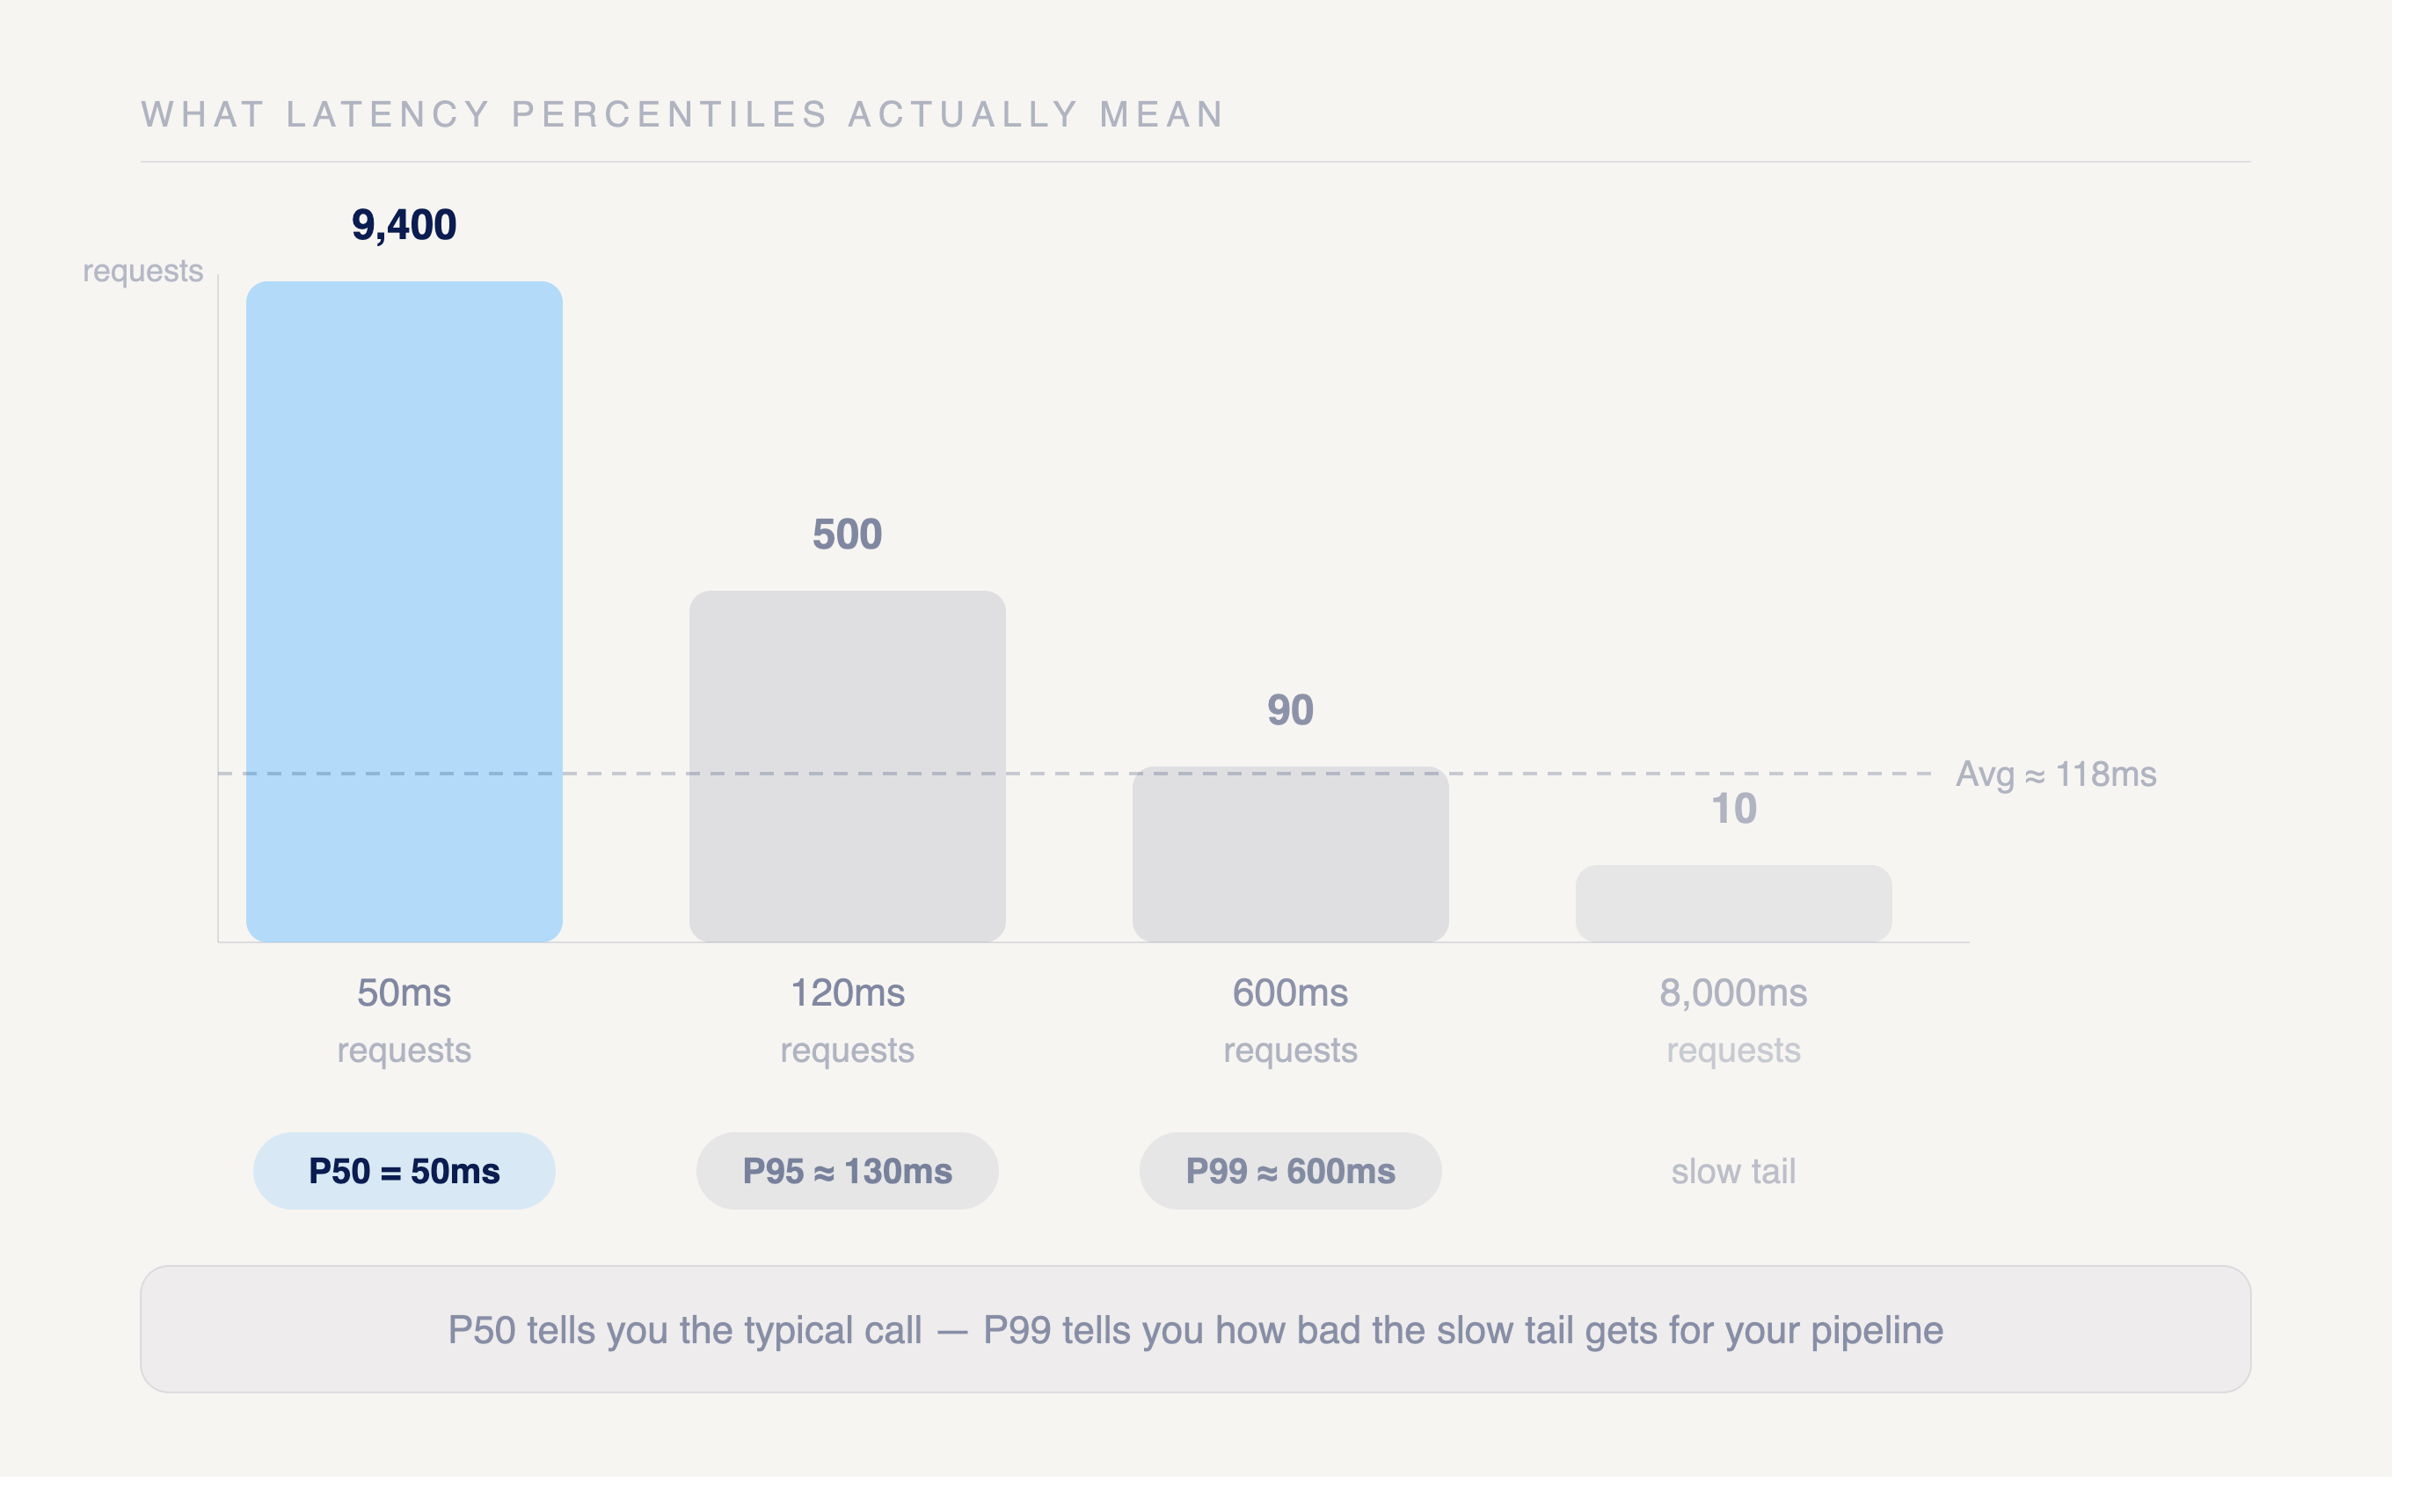
P99 matters most when you enrich leads in real time. A user submits a form, your app calls the enrichment API, and the response blocks the screen until data returns. The fast 99% never see a problem. The slow 1% wait seconds, abandon the form, or trip a timeout that drops the lead entirely. High-value traffic often lands in that tail, so a poor P99 quietly costs you conversions while the average looks fine.
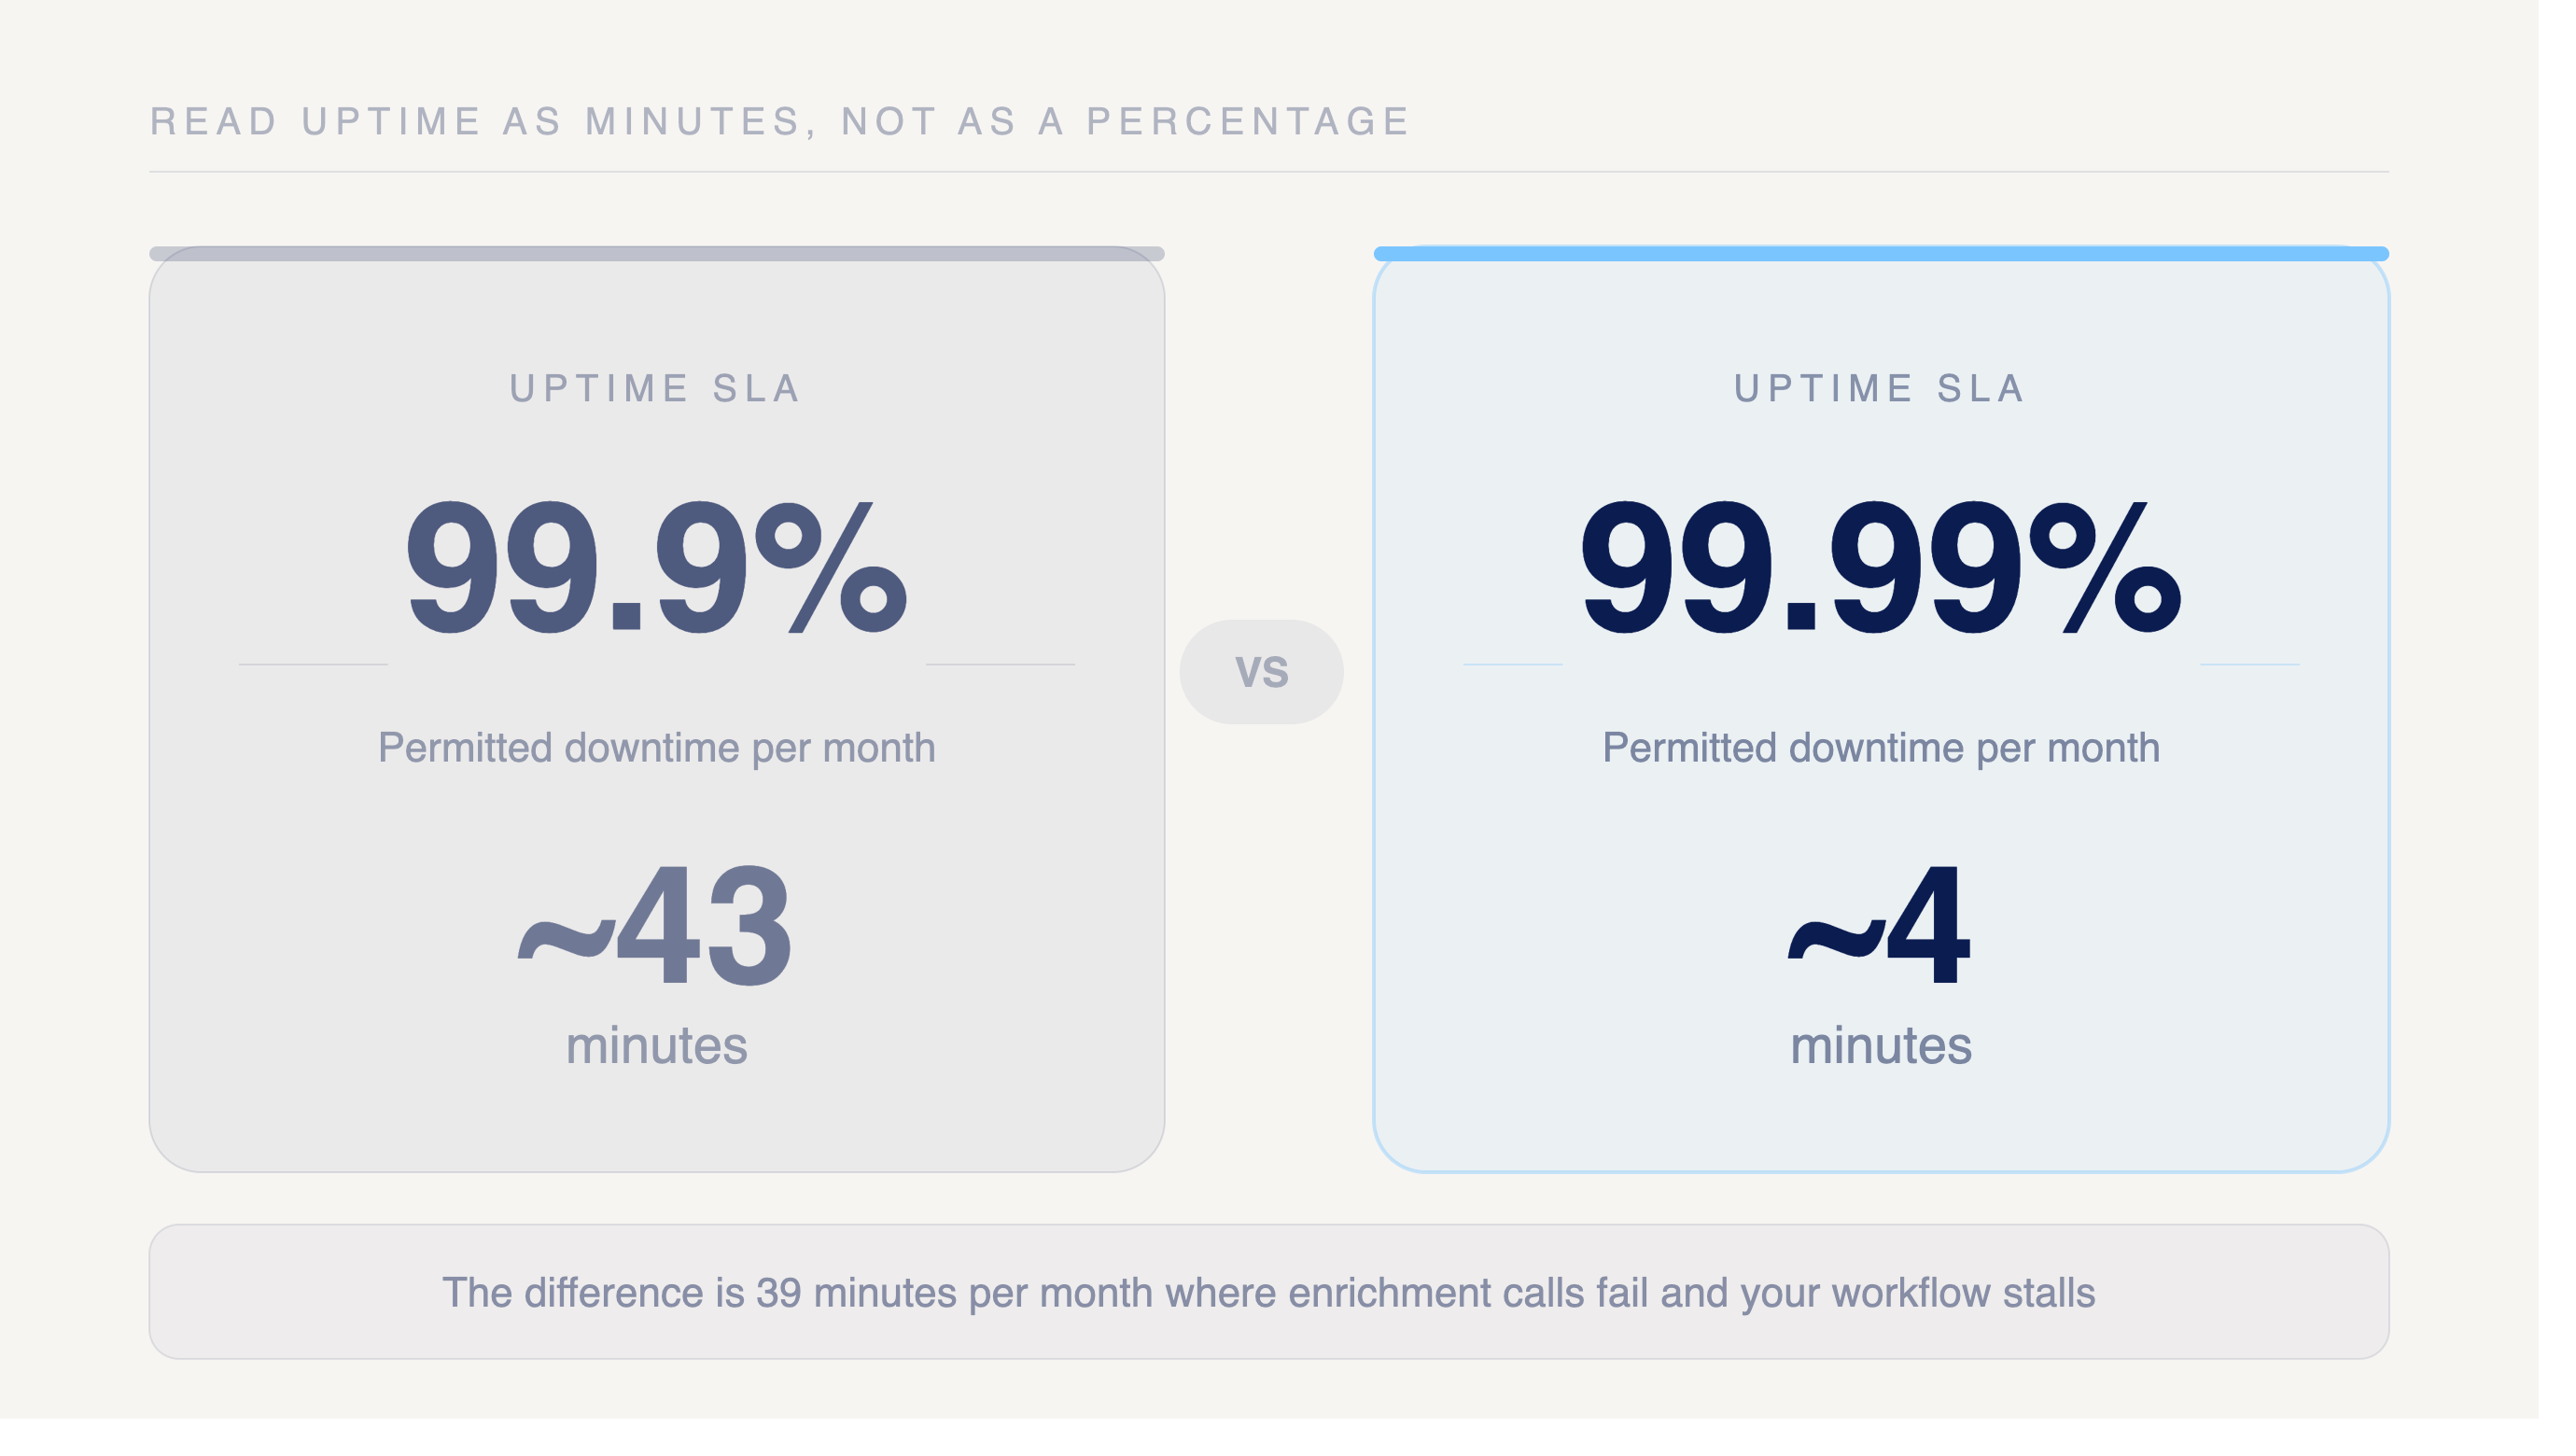
Read uptime as minutes, not as a clean percentage. A 99.9% SLA permits roughly 43 minutes of downtime each month. A 99.99% SLA tightens that to about 4 minutes. The difference is 39 minutes per month where your enrichment calls fail and your workflow stalls.
Latency benchmarks
The Openmart enrichment API returns single-record lookups well inside the P95 thresholds most real-time workflows demand. Batch enrichment trades per-record speed for higher aggregate throughput, so its percentiles run wider by design.
Note: Specific latency percentile figures (P50/P95/P99) are not yet published. Contact Openmart for current benchmark data or run your own latency tests against the API to establish baseline numbers for your integration.
Measurement conditions shape every number above. These figures reflect US-region requests with standard payload sizes against a warm cache. Cold-cache lookups against the underlying datastore push the tail higher, and that fallback path drives most P99 outliers (oneuptime.com).
Large payloads and cross-region routing add their own tail. A request that hits cache and stays in-region tracks close to P50. The same request after a cache miss, with a heavy payload, lands in the P99 bucket.
Enterprise B2B platforms tend to post respectable P50 numbers and then show wide P99 variance under load. Cold starts, lock contention, and retry storms surface in their worst 1% precisely when traffic spikes. Openmart's cache-first design keeps the gap between P50 and P99 tighter, which matters more than a fast median when you are enriching leads at the moment of capture and a stalled request blocks the form.
Uptime SLA and reliability guarantees
Openmart targets a 99.9% uptime SLA on the enrichment API. At 99.9%, that allows roughly 43 minutes of downtime per month. Push the target to 99.99% and the budget tightens to about 4.3 minutes per month. Confirm the contractual figure before you build alerting around it.
The API is deployed in a single US region, so a regional outage would affect availability. Openmart maintains a staging environment that can be promoted for disaster recovery. Check whether the SLA scope excludes degradation in third-party data sources that Openmart queries to enrich a record. Many providers carve out upstream dependency failures, which means your observed reliability can sit below the headline number even when Openmart's own infrastructure stays up.
That gap is the reliability trap LogicMonitor flags in its monitoring framework. A 99.99% uptime claim can be undermined when an upstream API degrades and that latency or failure cascades downstream to your request (logicmonitor.com). Read the SLA language carefully to learn which failures count against the credit and which fall outside scope. Then measure availability from your own client, not just from Openmart's status reporting, so you see the reliability your application actually experiences.
Rate limits and throughput
Rate limits cap how many requests you can send before Openmart throttles or rejects traffic. Limits are enforced per endpoint using a Redis-based leaky-bucket algorithm. The table below shows sustained request ceilings by endpoint group.
Endpoint Group RPS (Standard) RPS (Clay integration) Batch enrichment (find_people, lookup_people, lookup_business_email) 25 75 Batch tech lookup (find_tech) 15 20 Search / Enrich / Status 20 100
Throughput counts successful requests per unit time, measured in requests per minute or transactions per second. LogicMonitor treats throughput as the baseline for reading every other metric. A sudden drop signals that the system is failing or that upstream data sources have stalled, and a sudden spike often points to bot traffic hitting your key.
Concurrent request handling sets how many in-flight calls Openmart accepts at once before queuing. Your connection pool limit caps the open sockets your client holds. We recommend setting your connection pool size to 10-50 for HTTP clients, or matching your expected concurrent request volume. Size the pool below the concurrency ceiling so you never starve the queue with idle connections.
When Openmart returns a 429, retry with exponential backoff rather than hammering the endpoint. Start with a short delay, double it on each rejection, and add jitter so parallel workers do not retry in lockstep. Coordinated retries create the thundering herd that pushes P99 latency higher for everyone on the same tier.
Best for: matching use case to API performance profile
Match your workload to the benchmark that governs it before you commit to a plan tier.
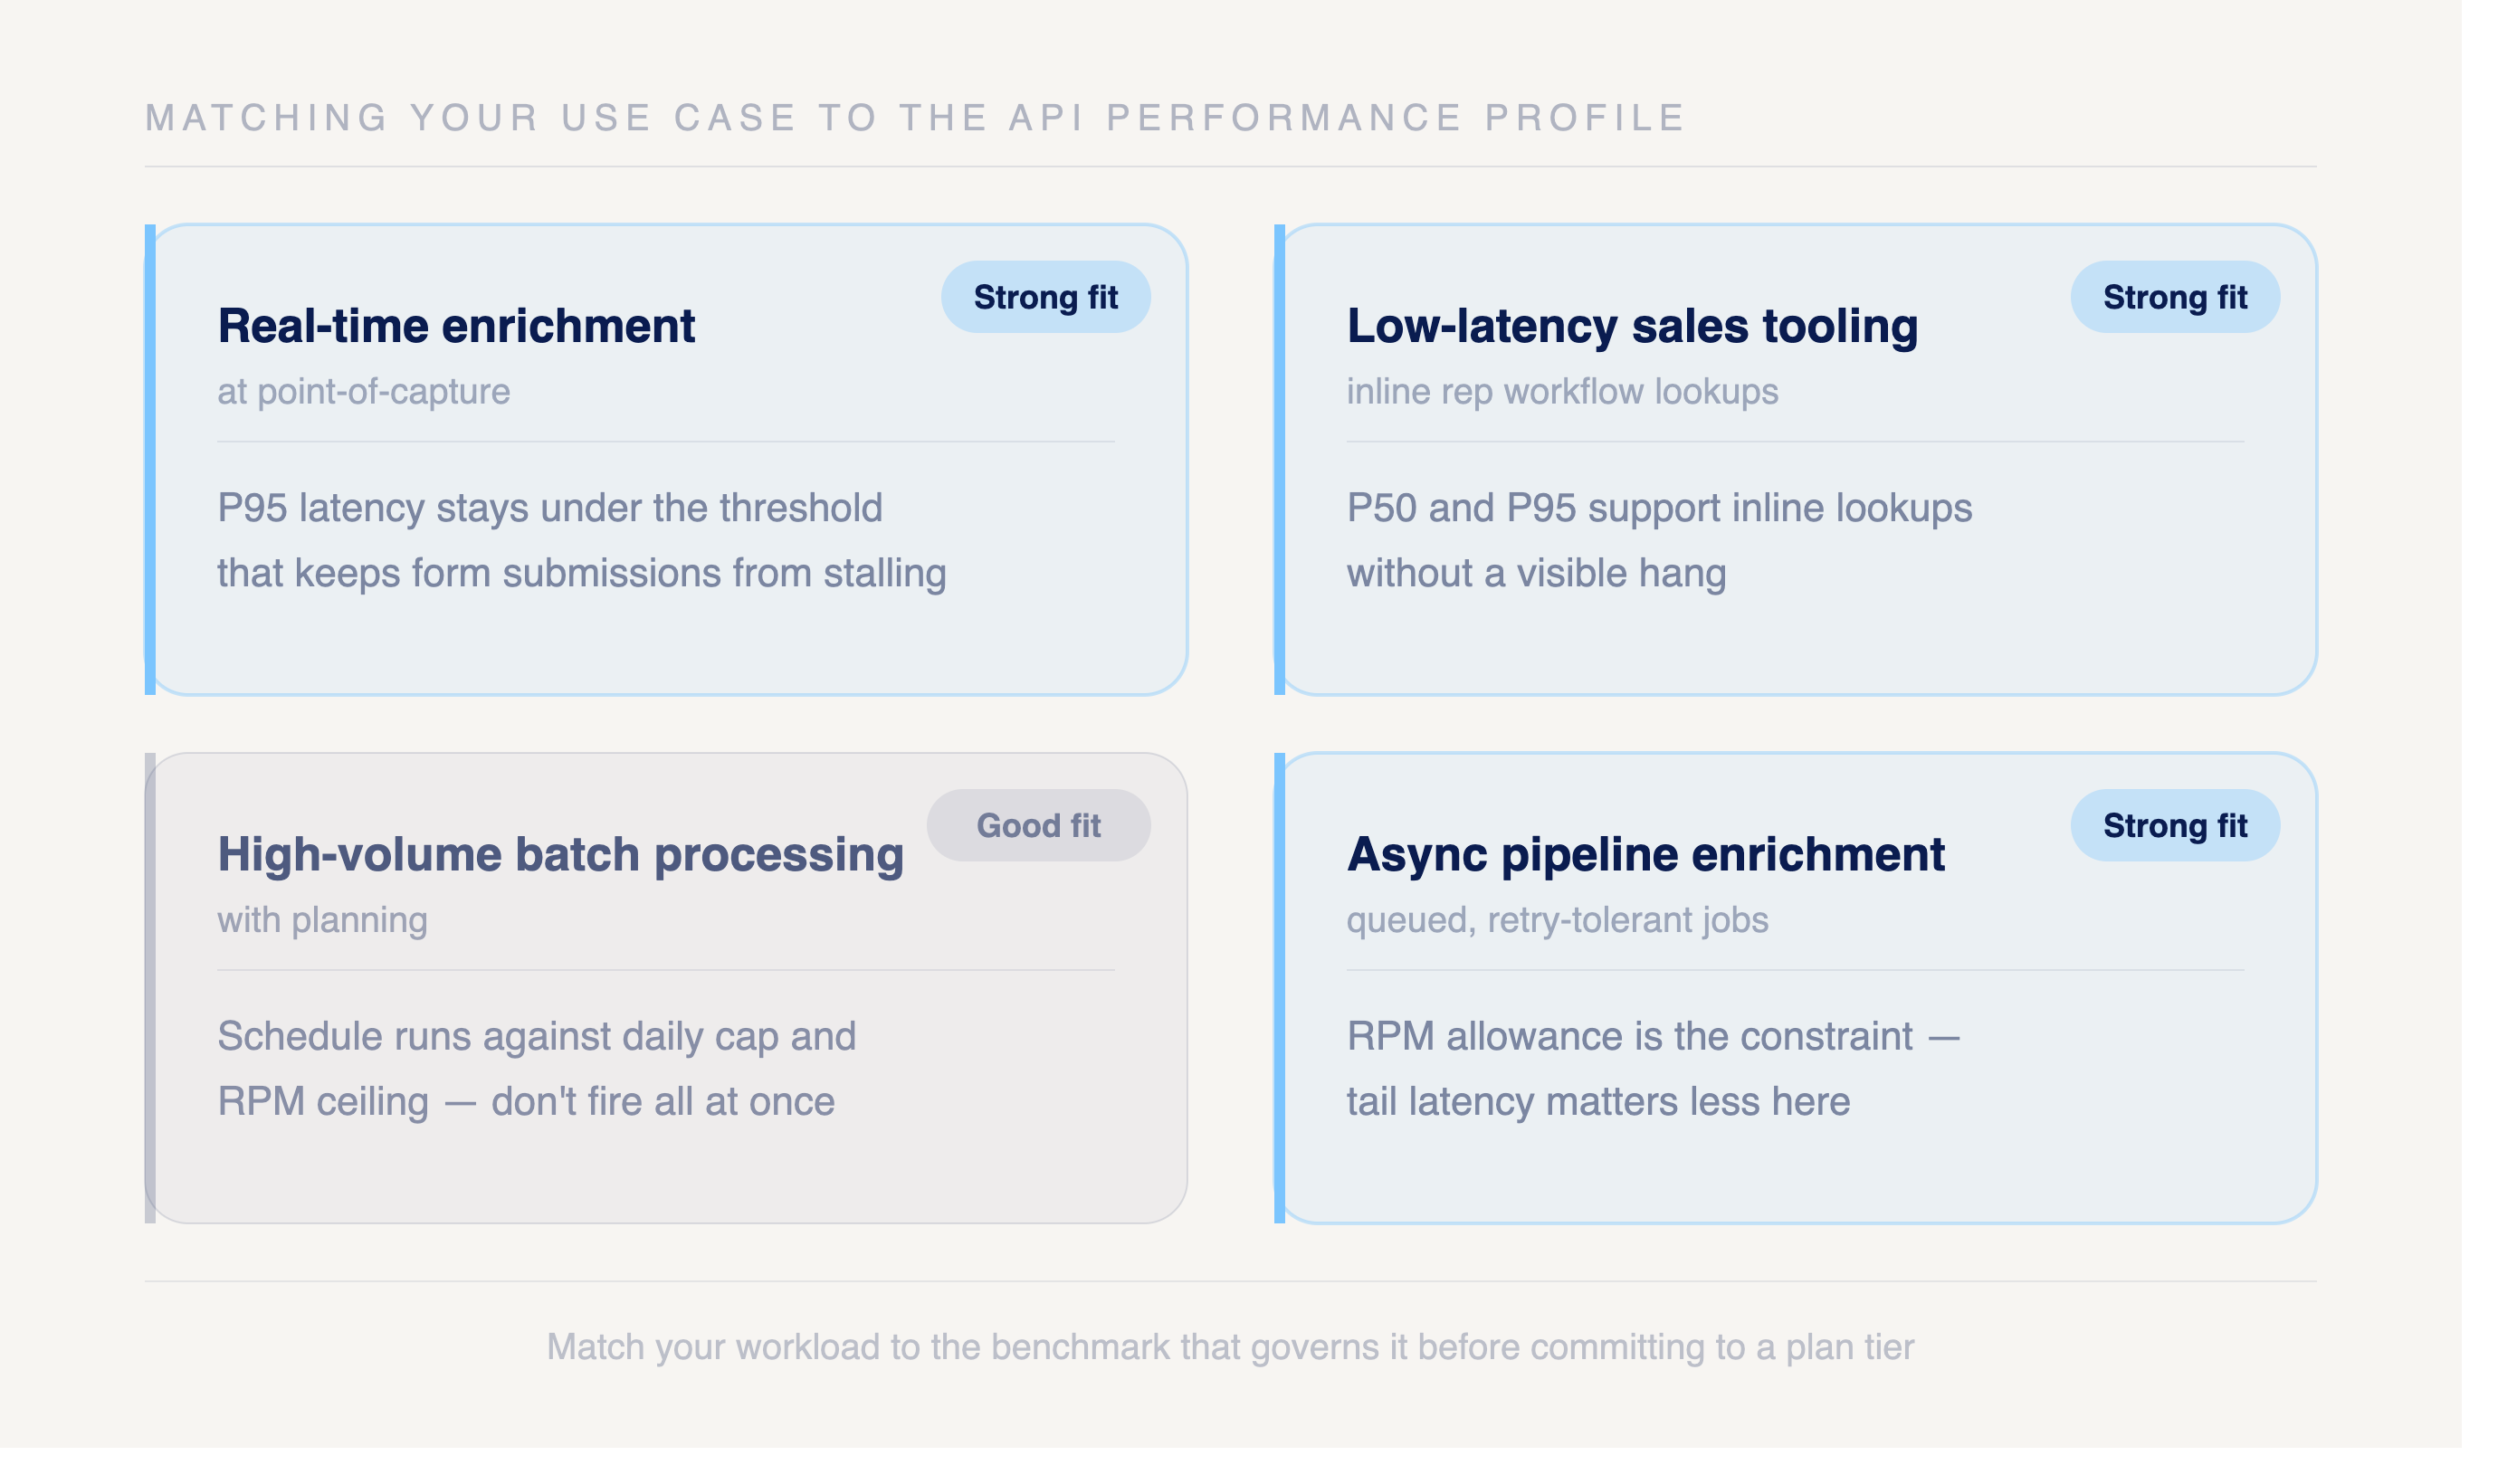
Real-time enrichment at point-of-capture. Strong fit. Openmart's P95 latency stays under the threshold that keeps a form submission or signup flow from stalling, where enterprise B2B platforms with higher P99 variance leave a fraction of users waiting on slow tail requests.
Low-latency sales tooling. Strong fit. P50 and P95 figures support inline lookups inside a rep's workflow without a visible hang, as long as you size your plan to the RPS limit for interactive bursts.
High-volume batch processing. Good fit with planning. Bulk throughput carries large jobs, but the daily cap and RPM ceiling set the pace, so schedule runs against those limits rather than firing everything at once.
Async pipeline enrichment. Strong fit. Queued, retry-tolerant jobs absorb the occasional P99 outlier without user-facing impact, which makes the RPM allowance the constraint that matters more than tail latency.
Pick the use case that describes most of your traffic, then read the benchmark tables above against that profile.
How to monitor your integration
Set your primary service-level objective on P95 latency, not the average. A target like "95% of enrichment requests complete under your agreed P95 threshold over 30 days" gives you a single number to defend in a contract and a clean error budget to track. Averages hide the worst 1% of requests where your highest-value lookups often sit, so build alerts on percentiles instead (oneuptime.com).
Add a divergence alert that fires when P99 exceeds 3x P50 for 15 minutes. That ratio catches cold starts, cache misses, and retry storms before they cascade into your pipeline.
Track four client-side metrics against every Openmart call. Response time tells you how long a lookup takes, failed request rate flags errors, throughput in requests per minute reveals when the system is under stress, and availability confirms the endpoint is reachable (logicmonitor.com).
If Openmart sits inside a distributed enrichment system, run end-to-end tracing across DNS, your network hops, and the API call so you can pinpoint which dependency owns a slow request.
FAQs
How is uptime SLA calculated and what exclusions apply?
Openmart measures uptime as the percentage of time the enrichment API responds successfully across a rolling monthly window. Scheduled maintenance windows and degradation traced to upstream third-party data sources fall outside SLA scope. Check the contract for the exact exclusion language before you build a hard SLO on top of it.
What happens when I exceed my rate limit, hard block or throttle?
Requests over the rate limit return a 429 (Too Many Requests) response rather than dropping the connection. The response includes an error message but does not currently include a Retry-After header. Use exponential backoff with jitter when you receive a 429. Sustained overage may result in requests being rejected until the rate-limit window resets.
Are latency benchmarks measured server-side or end-to-end?
When latency figures are provided, they reflect server-side processing time, not the full round trip through your network, DNS, or CDN. Your observed end-to-end latency will be higher. Instrument the client to capture the difference.
Does Openmart publish a real-time status page?
No. Openmart does not currently publish a public status page. The API exposes internal healthcheck endpoints (/healthcheck and /health-check) that return basic status information, but these are operational health checks, not customer-facing status pages with uptime history or incident reporting.
What is the recommended retry strategy for P99 outlier requests?
Use exponential backoff with jitter and cap total retries to avoid thundering-herd load. Set a client timeout near your P99 target so slow outliers fail fast.
Related articles


Start reaching local businesses today
No credit card required
200M+ local business databases

.png)
